Linear Regression simplified !

I am a Full Stack Developer from Mumbai, India. Currently I'm pursuing my Bachelors in Computer Science.
Linear regression is a fundamental machine learning technique used to understand the relationship between two continuous variables. In this post, we'll cover the key concepts you need to know to get started with linear regression.
What is Linear Regression?
Linear regression is all about fitting a straight line to a set of data points. Specifically, it helps us understand how two variables are related by drawing an imaginary straight line that best "fits" the data points.
The line is described by its slope and intercept
The slope tells us how steep the line is. Is it rising sharply or is it relatively flat?
The intercept is where the line crosses the y-axis.
These two parameters describe the relationship between the variables.
The Linear Regression Equation
The equation for a simple linear regression line is:
y = mx + b
Where:
m is the slope
b is the intercept
x and y are the two variables
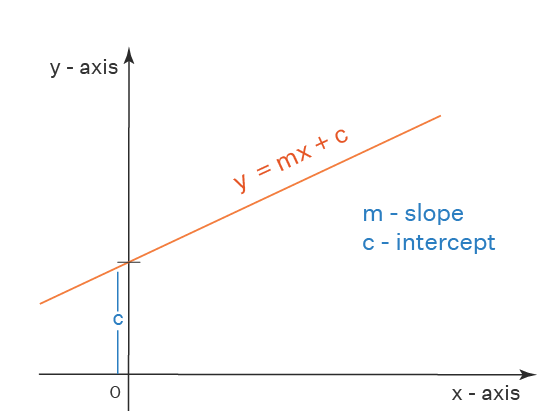
This simple equation allows us to model the linear relationship between the variables.
A Simple Example
Let's look at a basic example to see linear regression in action.
Imagine we are interested in understanding the relationship between study time and test scores. We collect data on hours studied vs test scores for several students. Using linear regression, we can fit a line to this data to see if more study time leads to higher scores.
The slope and intercept give us insights into how strong the relationship is. We can use this line to predict future test scores based on hours studied.
Evaluating Linear Regression Models
Of course, linear regression has its limitations. Sometimes the line we fit does not capture the true relationship very well. This could happen if the data is very scattered or the true relationship is non-linear.
Two key metrics used to evaluate linear regression models are:
RMSE - How far off the predictions are from the actual values
R-squared - How much variance in the data is explained by the model
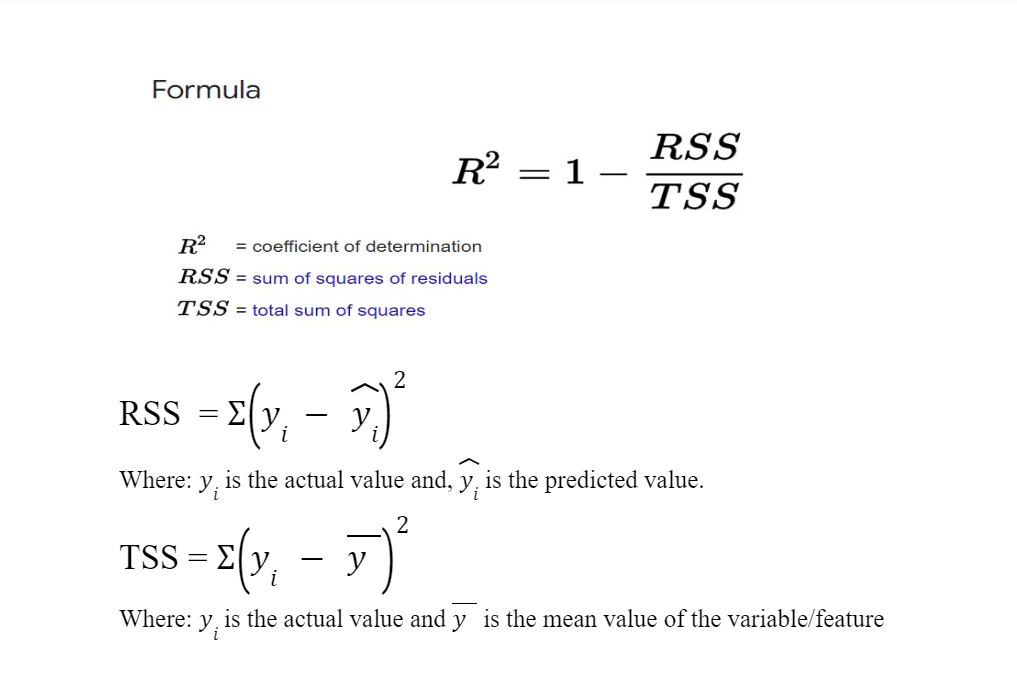
The closer these are to 0 and 100% respectively, the better the model.
Conclusion
Despite its simplicity, linear regression is an incredibly useful modeling tool. It allows us to quantify linear relationships and make predictions from data. While it has limitations, it provides a strong foundation to build more advanced models.


